It’s not used --> Users don’t usually read documentation stored ‘somewhere’ on a Confluence, a Sharepoint wiki or a shared file
It’s not maintained --> Documentation is almost always outdated
It’s disconnected --> Definitions and documentation are not kept in sync with your actual reports, datasets and applications
Let experts & key users add documentation directly from each page.
✔ Add hotspots on any chart
✔️ Reuse terminology
✔️ Relationships between terms & chats are suggested automatically
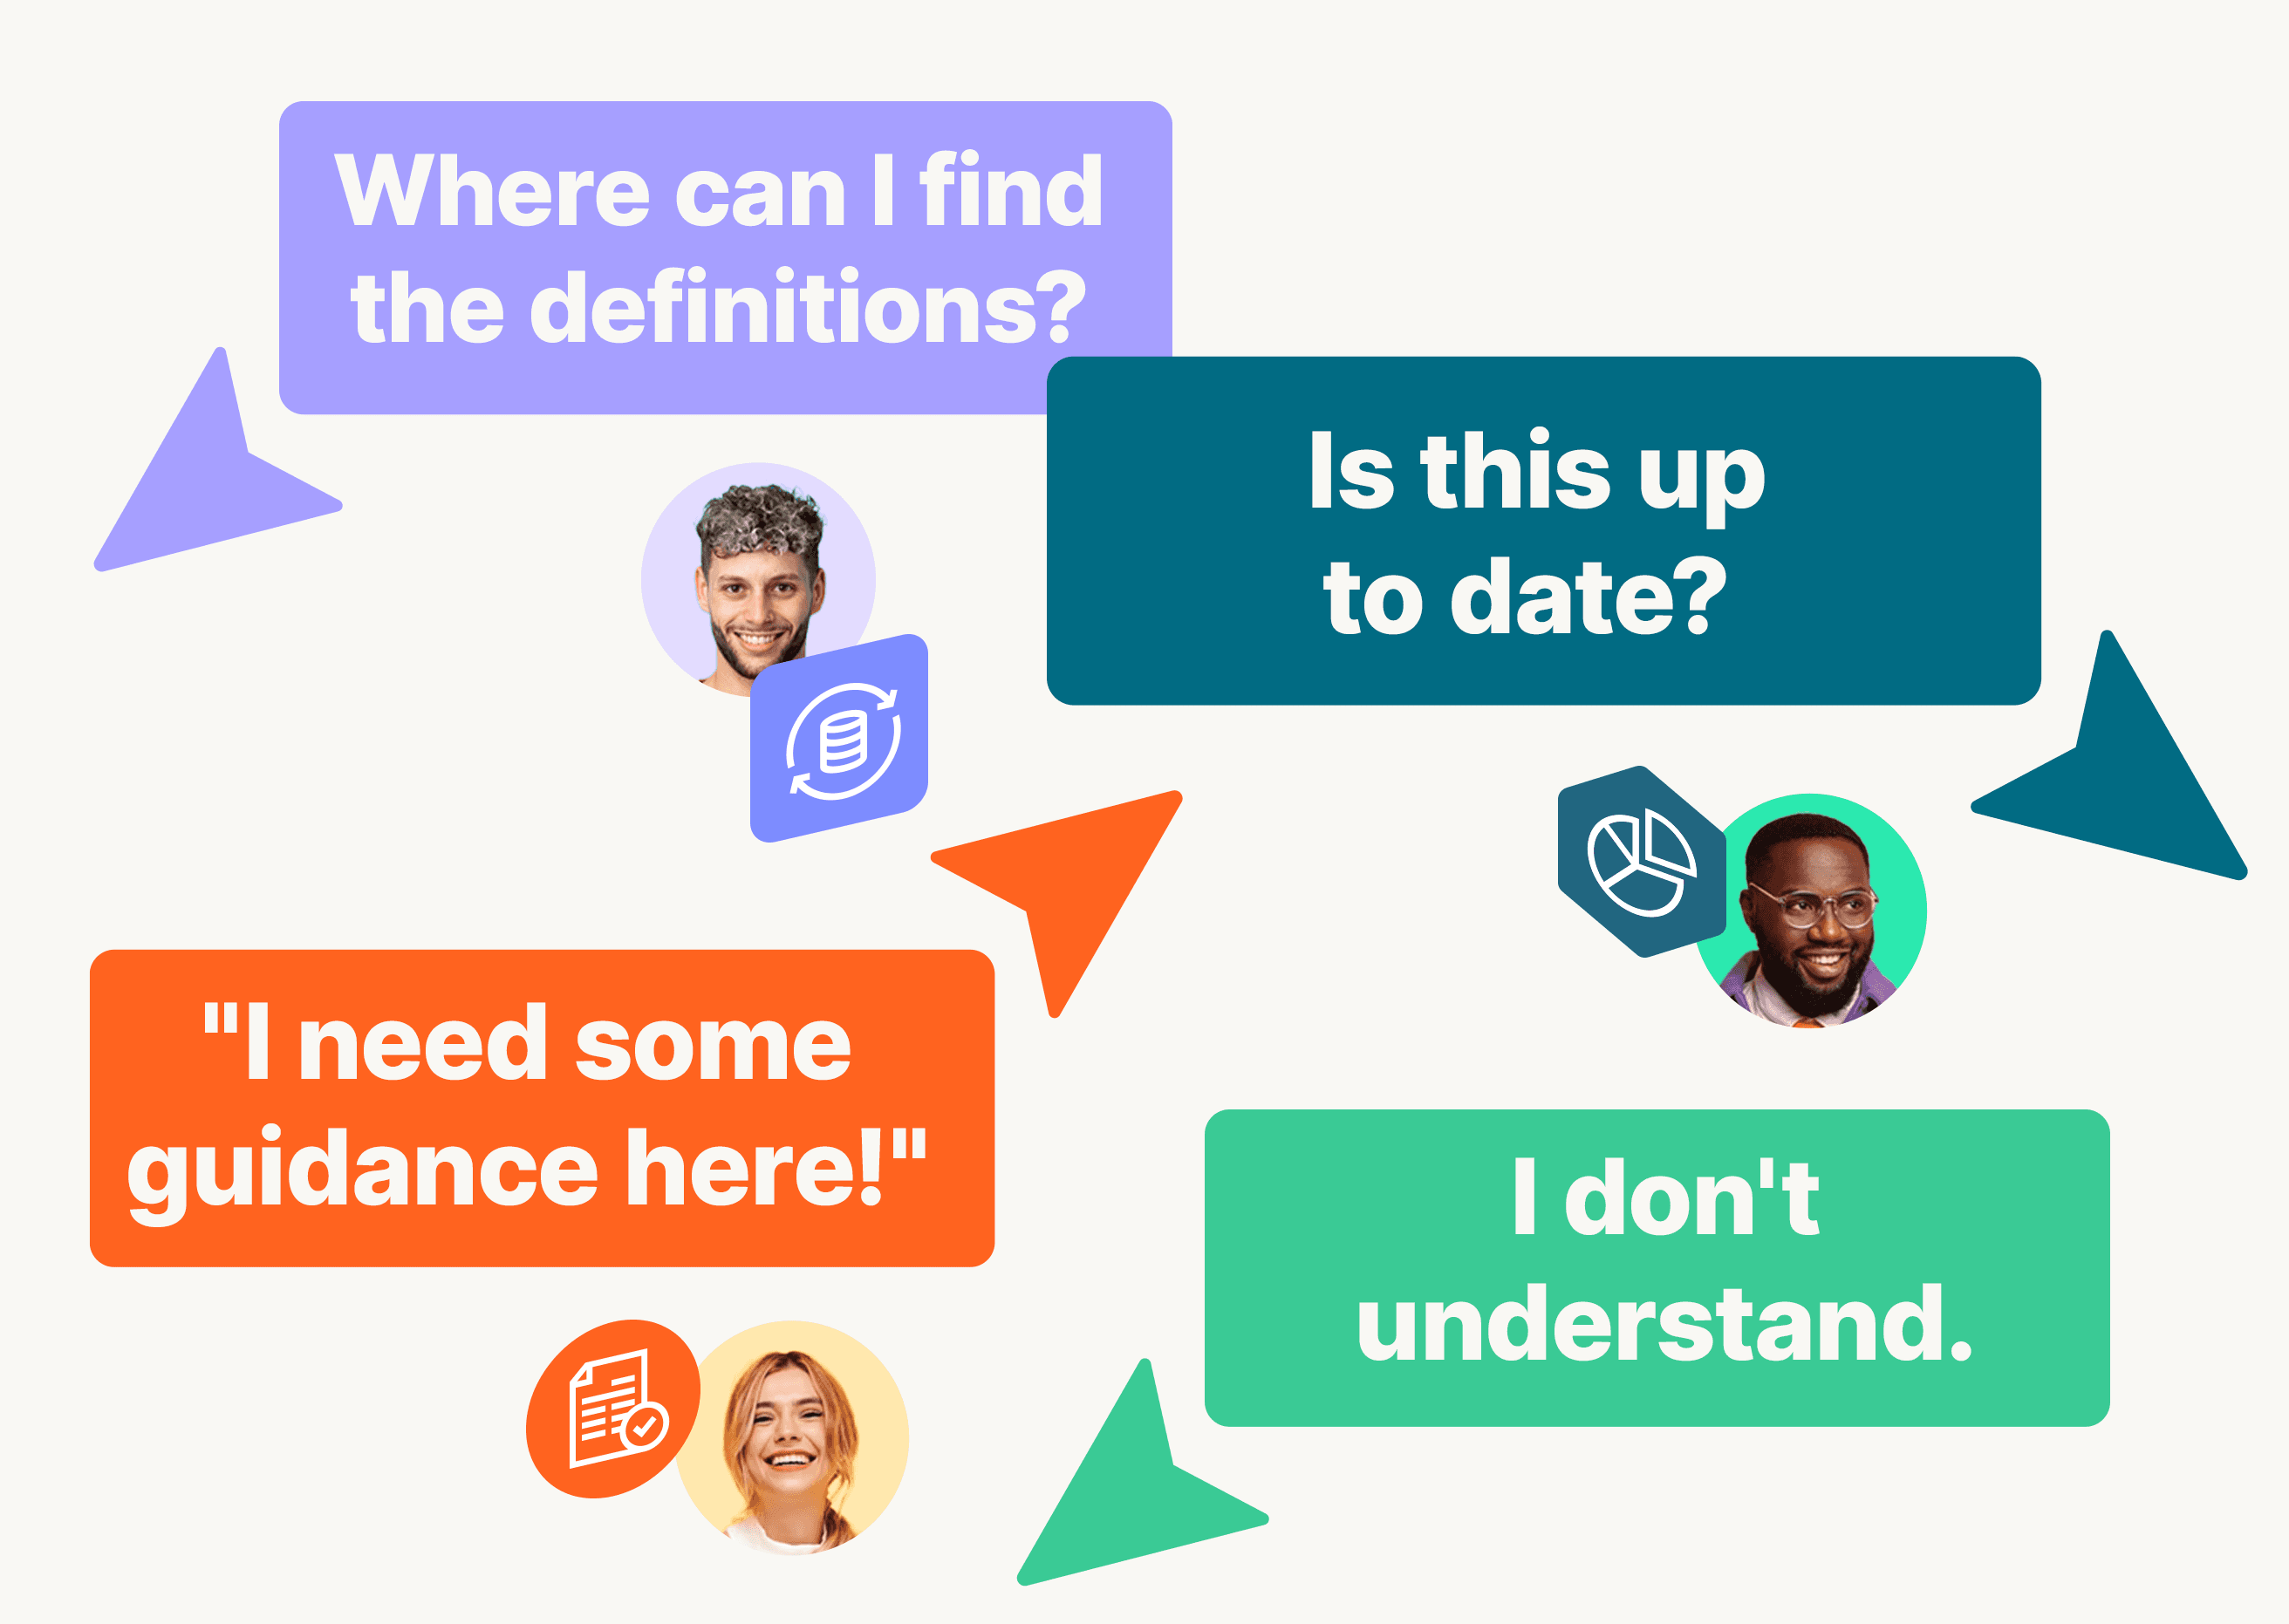
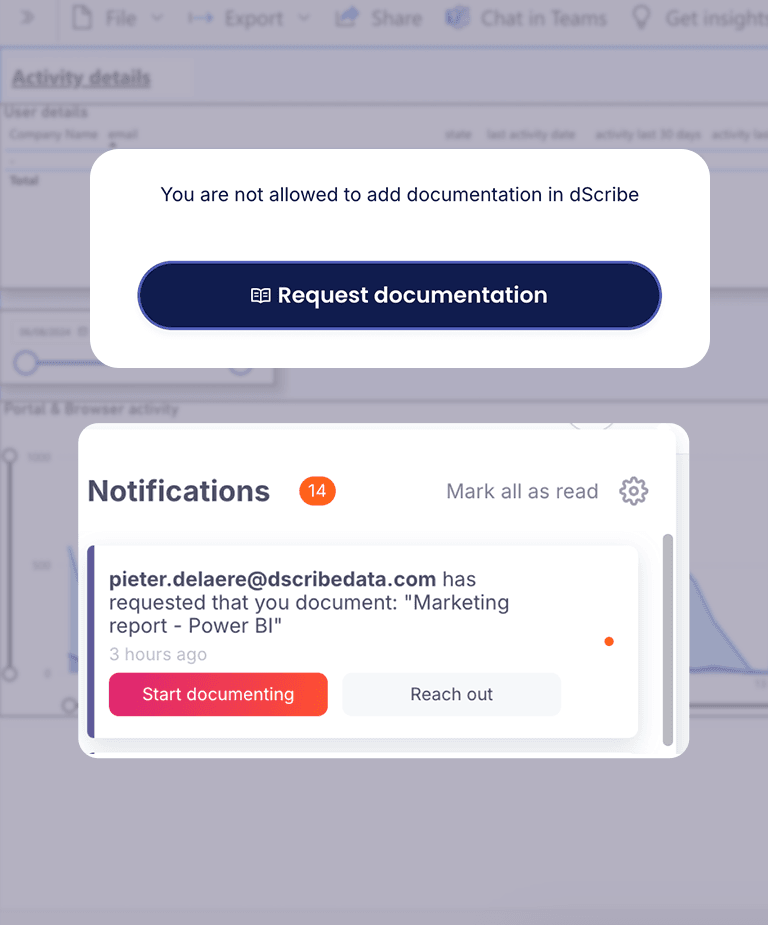
Viewers can request documentation from any page. And you get an overview of top-visited pages that currently do not have any documentation yet.
✔ Crowdsourced documentation requests
✔ Usage insights in your documentation and BI reports
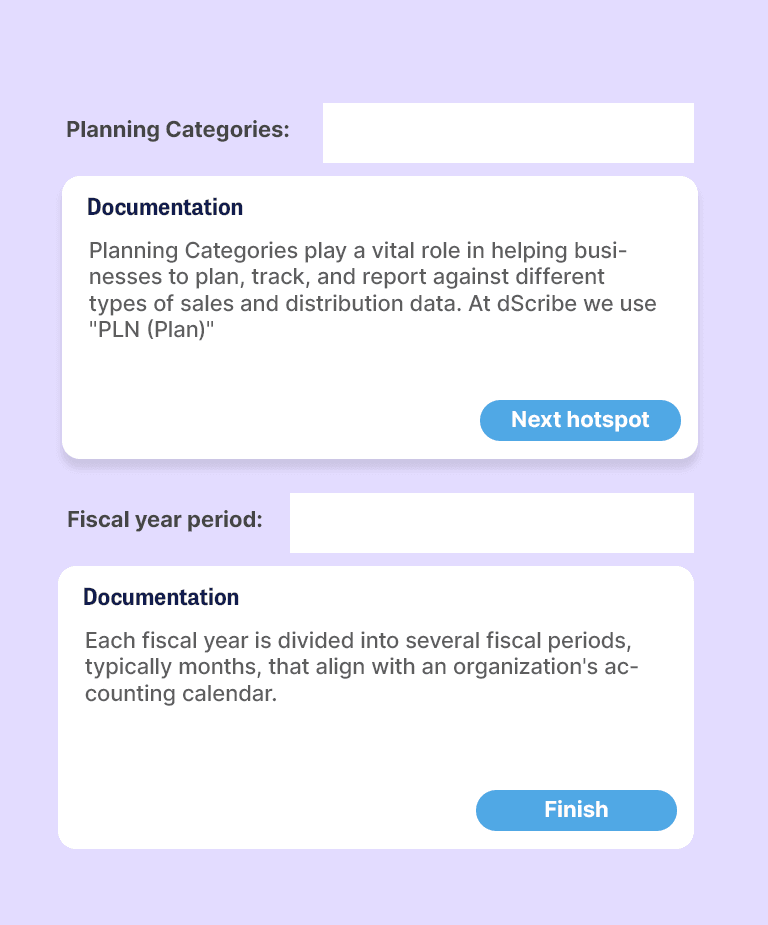
Users automatically get a walkthrough the first time they visit a documented report
✔ In-context page walkthroughs
✔ Tailored in-app notifications and alerts

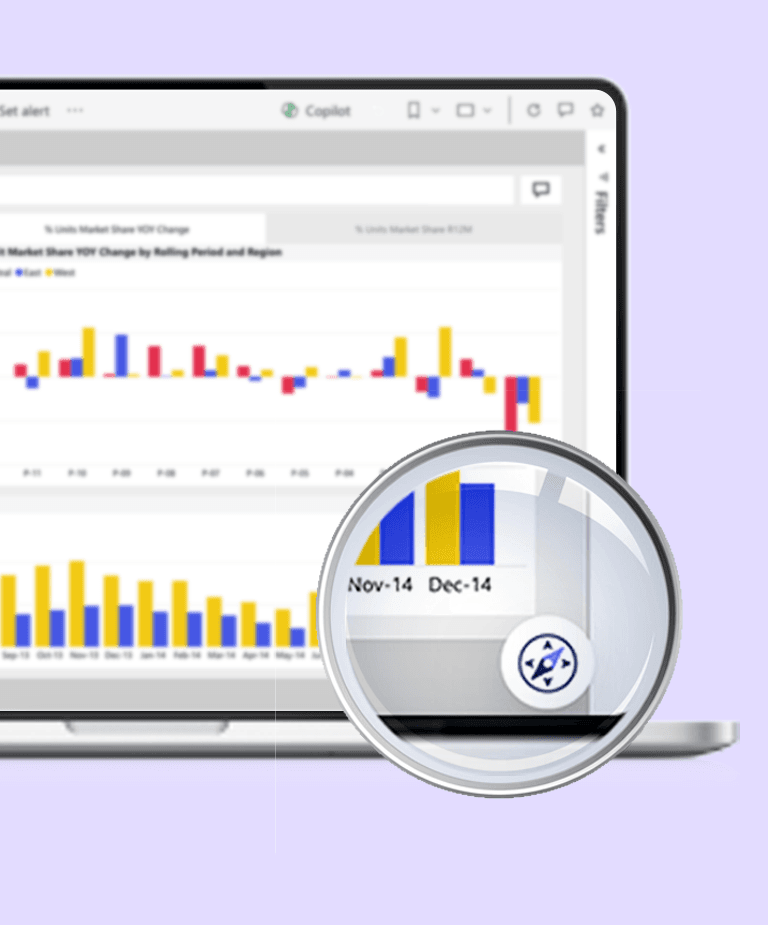
Access relevant documentation directly on any page
Add hotspots on any chart
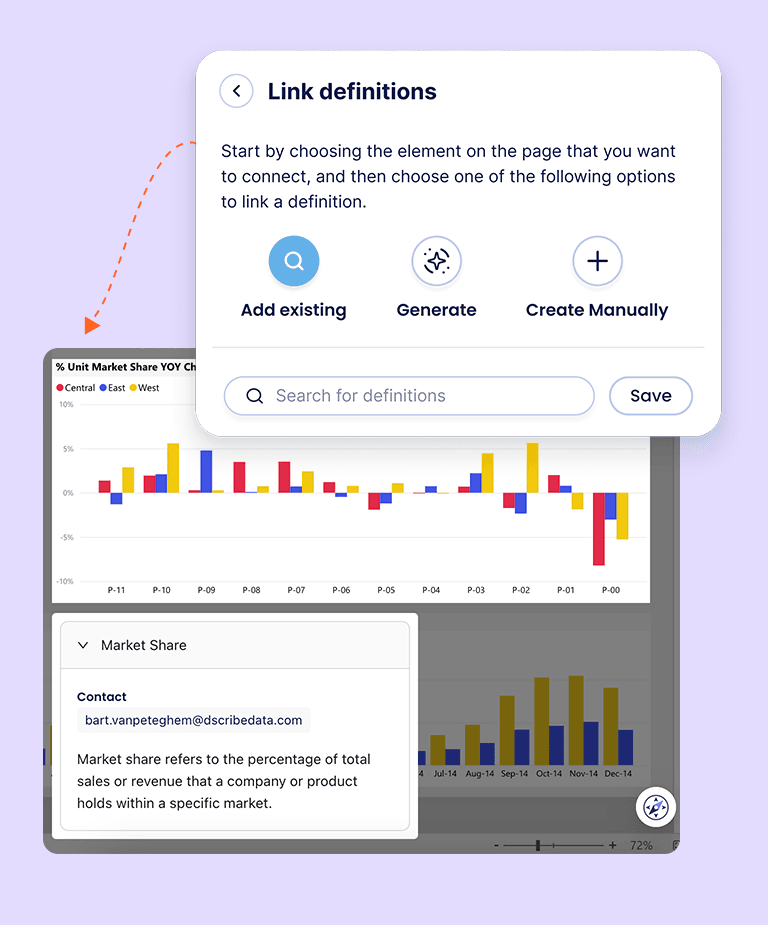
Never start documentation from scratch again

Show walkthroughs when users visit key reports for the first time
Avoid information overload: share updates and alerts in-context

Prioritize what matters: crowdsource documentation requests

Elevated Power BI understanding & usage at Wit-Gele Kruis
Wit-Gele Kruis West-Vlaanderen is a leading provider of in-home nursing care services in Belgium.

Group-wide reporting at BMT
BMT Group consists of high precision machining companies with market leadership positions in aerospace, automotive and glass molds.

Improving data understanding at Agristo
Agristo is a Belgian food company, specializing in frozen potato products.

Nurturing report adoption at De Watergroep
De Watergroep is a public utility for water distribution in Flanders. It manages a regional pipeline network of roughly 34,000 km long. Next to distributing drinkable tap water, it is also responsible for collecting and purification of wastewater.