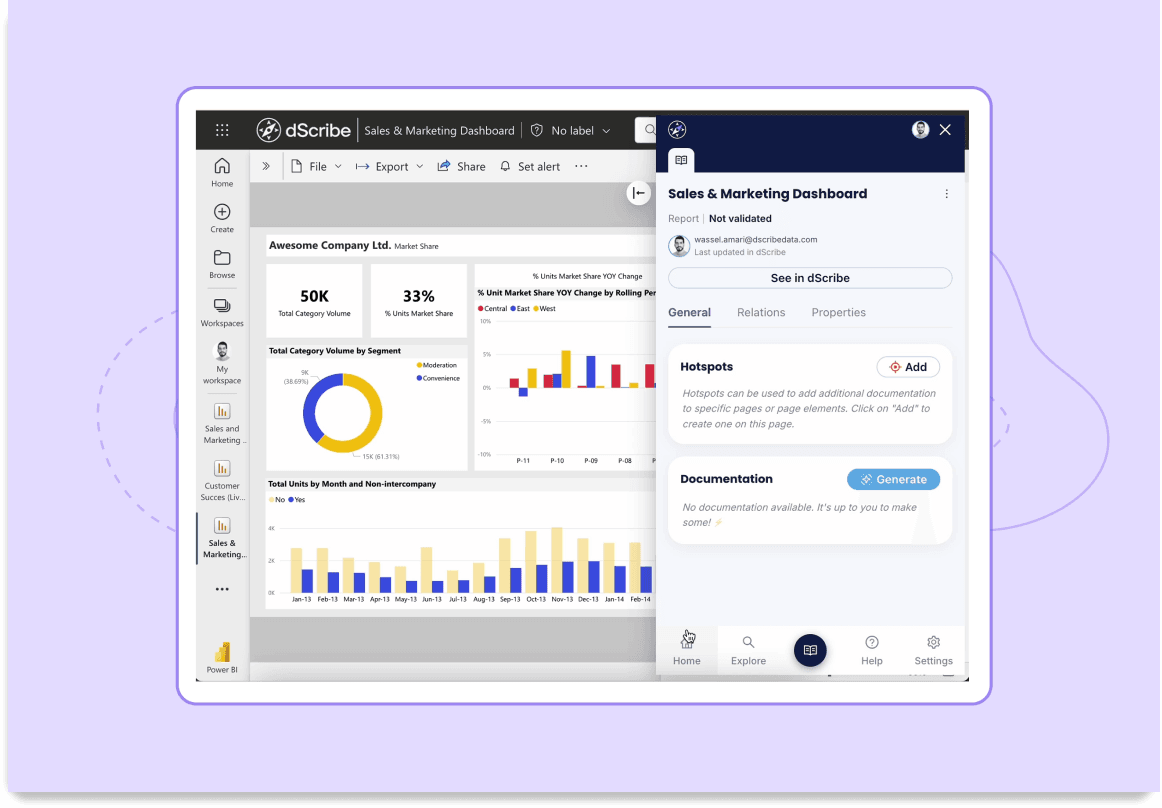
Report creators can add documentation to their reports with minimal effort
Ability to manage documentation from directly inside each report
No need to start from scratch: AI-generated report descriptions
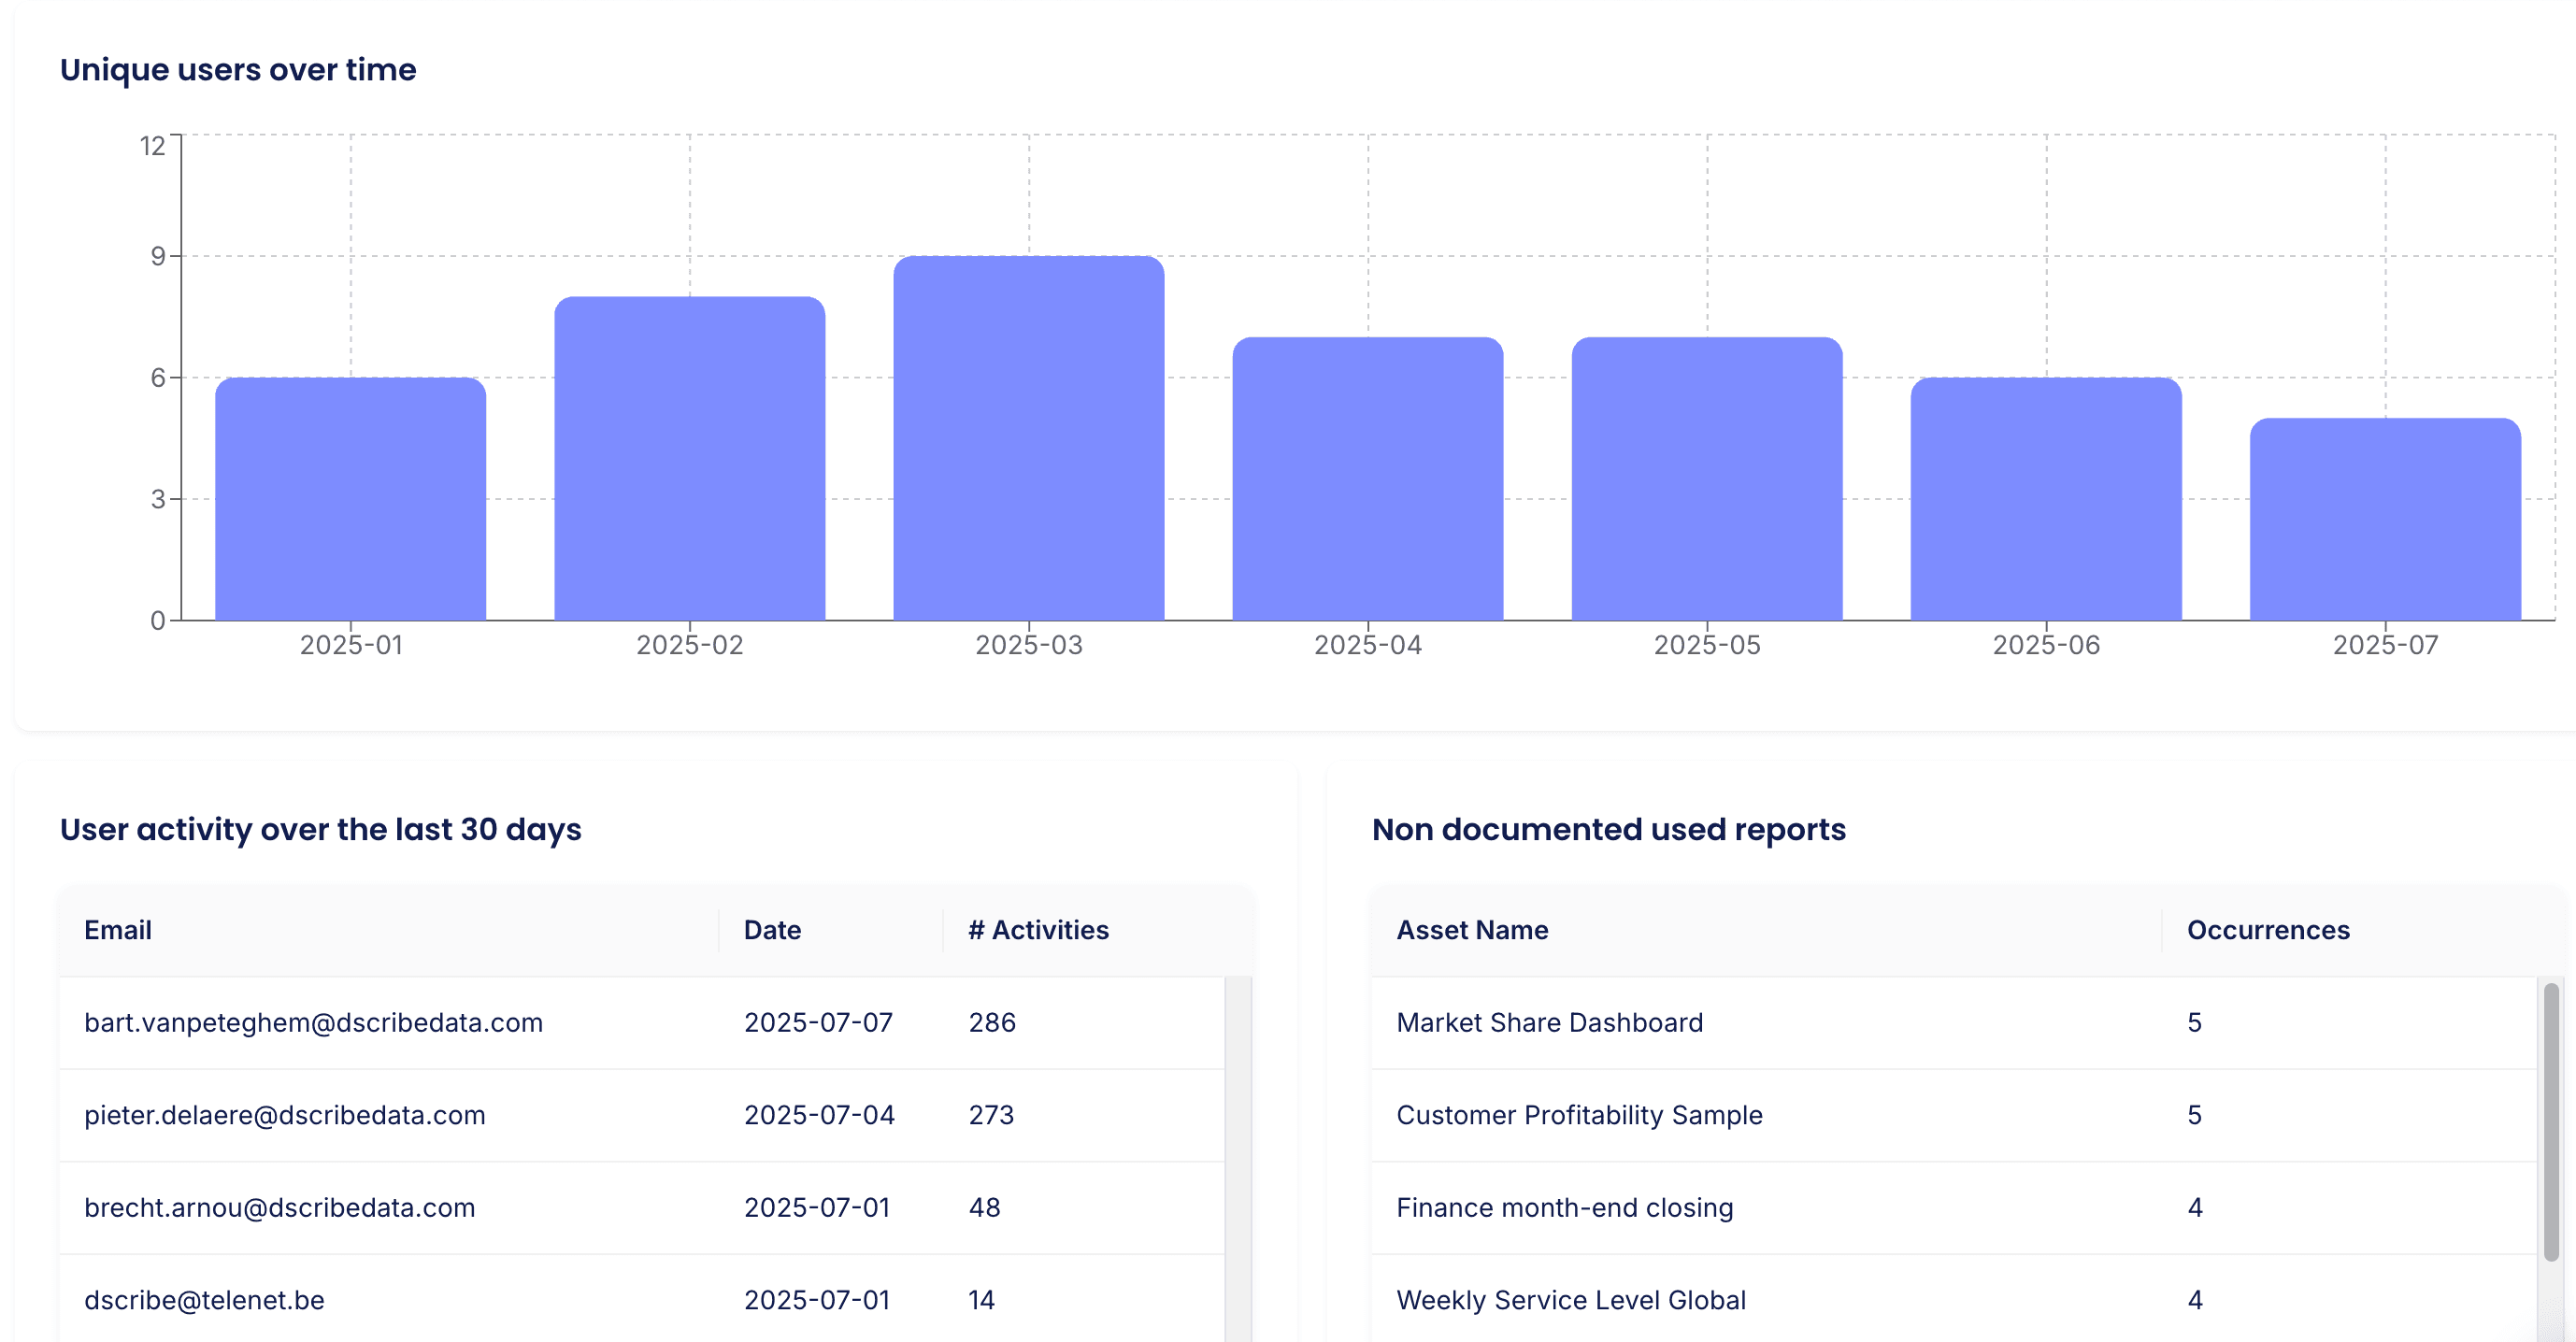
Usage-based prioritization
Get a list of most viewed reports that don’t have any documentation yet
Let users hit ‘Request documentation’ from any report page
Shared business glossary for maximum consistency
Establish a shared glossary with KPIs and data definitions
Get an automatic overview on all reports where each definition is being used

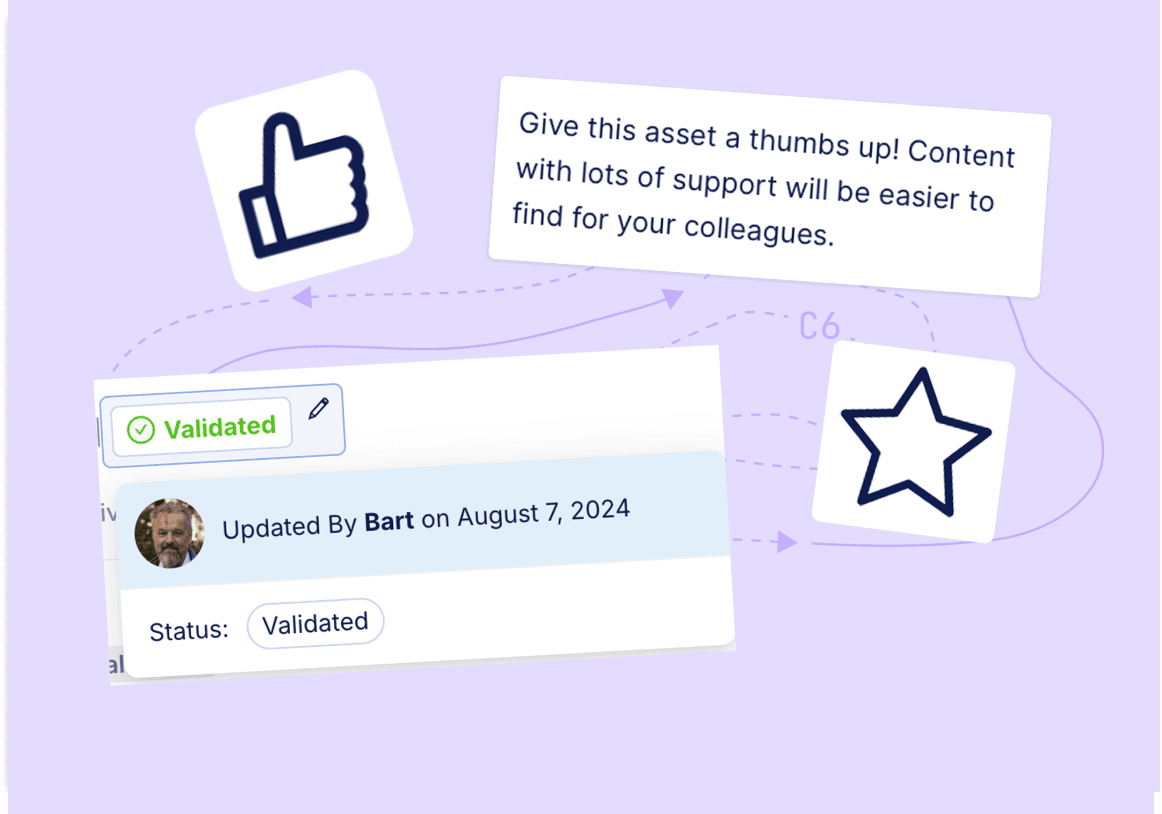
Report governance
An effective combination of crowdsourced endorsements and steward-controlled validation statuses
Ability to add custom classifications and assign stakeholders to each report
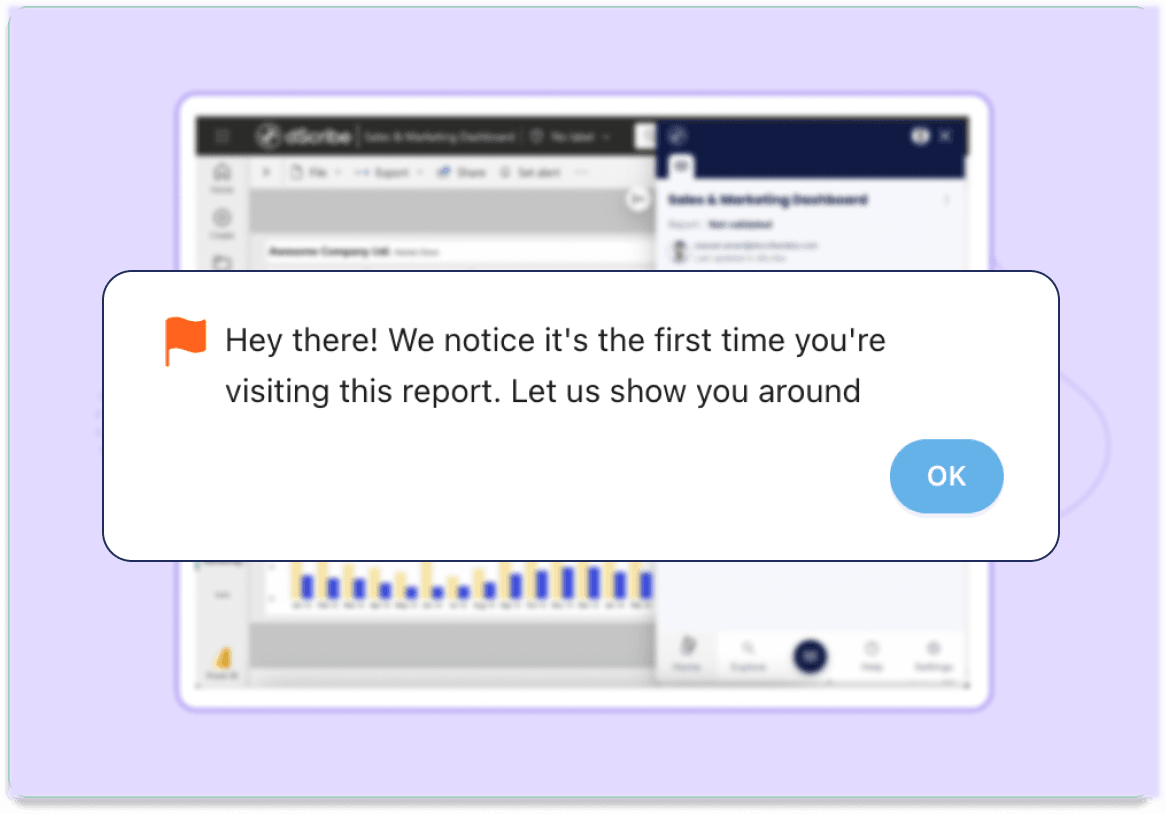
Maximum BI adoption & understanding
Every user automatically gets a walkthrough the first time they visit a documented report
Semantic search and shared views ensure users easily find all reports relevant to them
With dScribe we’ve created a thorough overview of all the available data and reports at De Watergroep. Through the convenient search functionality this overview is rapidly becoming the starting point for handling any new data-related questions and ideas.

Hans Van Ootegem
Project manager ICT/Data Analytics

Elevated Power BI understanding & usage at Wit-Gele Kruis
Wit-Gele Kruis West-Vlaanderen is a leading provider of in-home nursing care services in Belgium.

Nurturing report adoption at De Watergroep
De Watergroep is a public utility for water distribution in Flanders. It manages a regional pipeline network of roughly 34,000 km long. Next to distributing drinkable tap water, it is also responsible for collecting and purification of wastewater.